Our software
EnExpert Energy Management
Real-time energy monitoring and load optimization for industry and SMEs
What it is
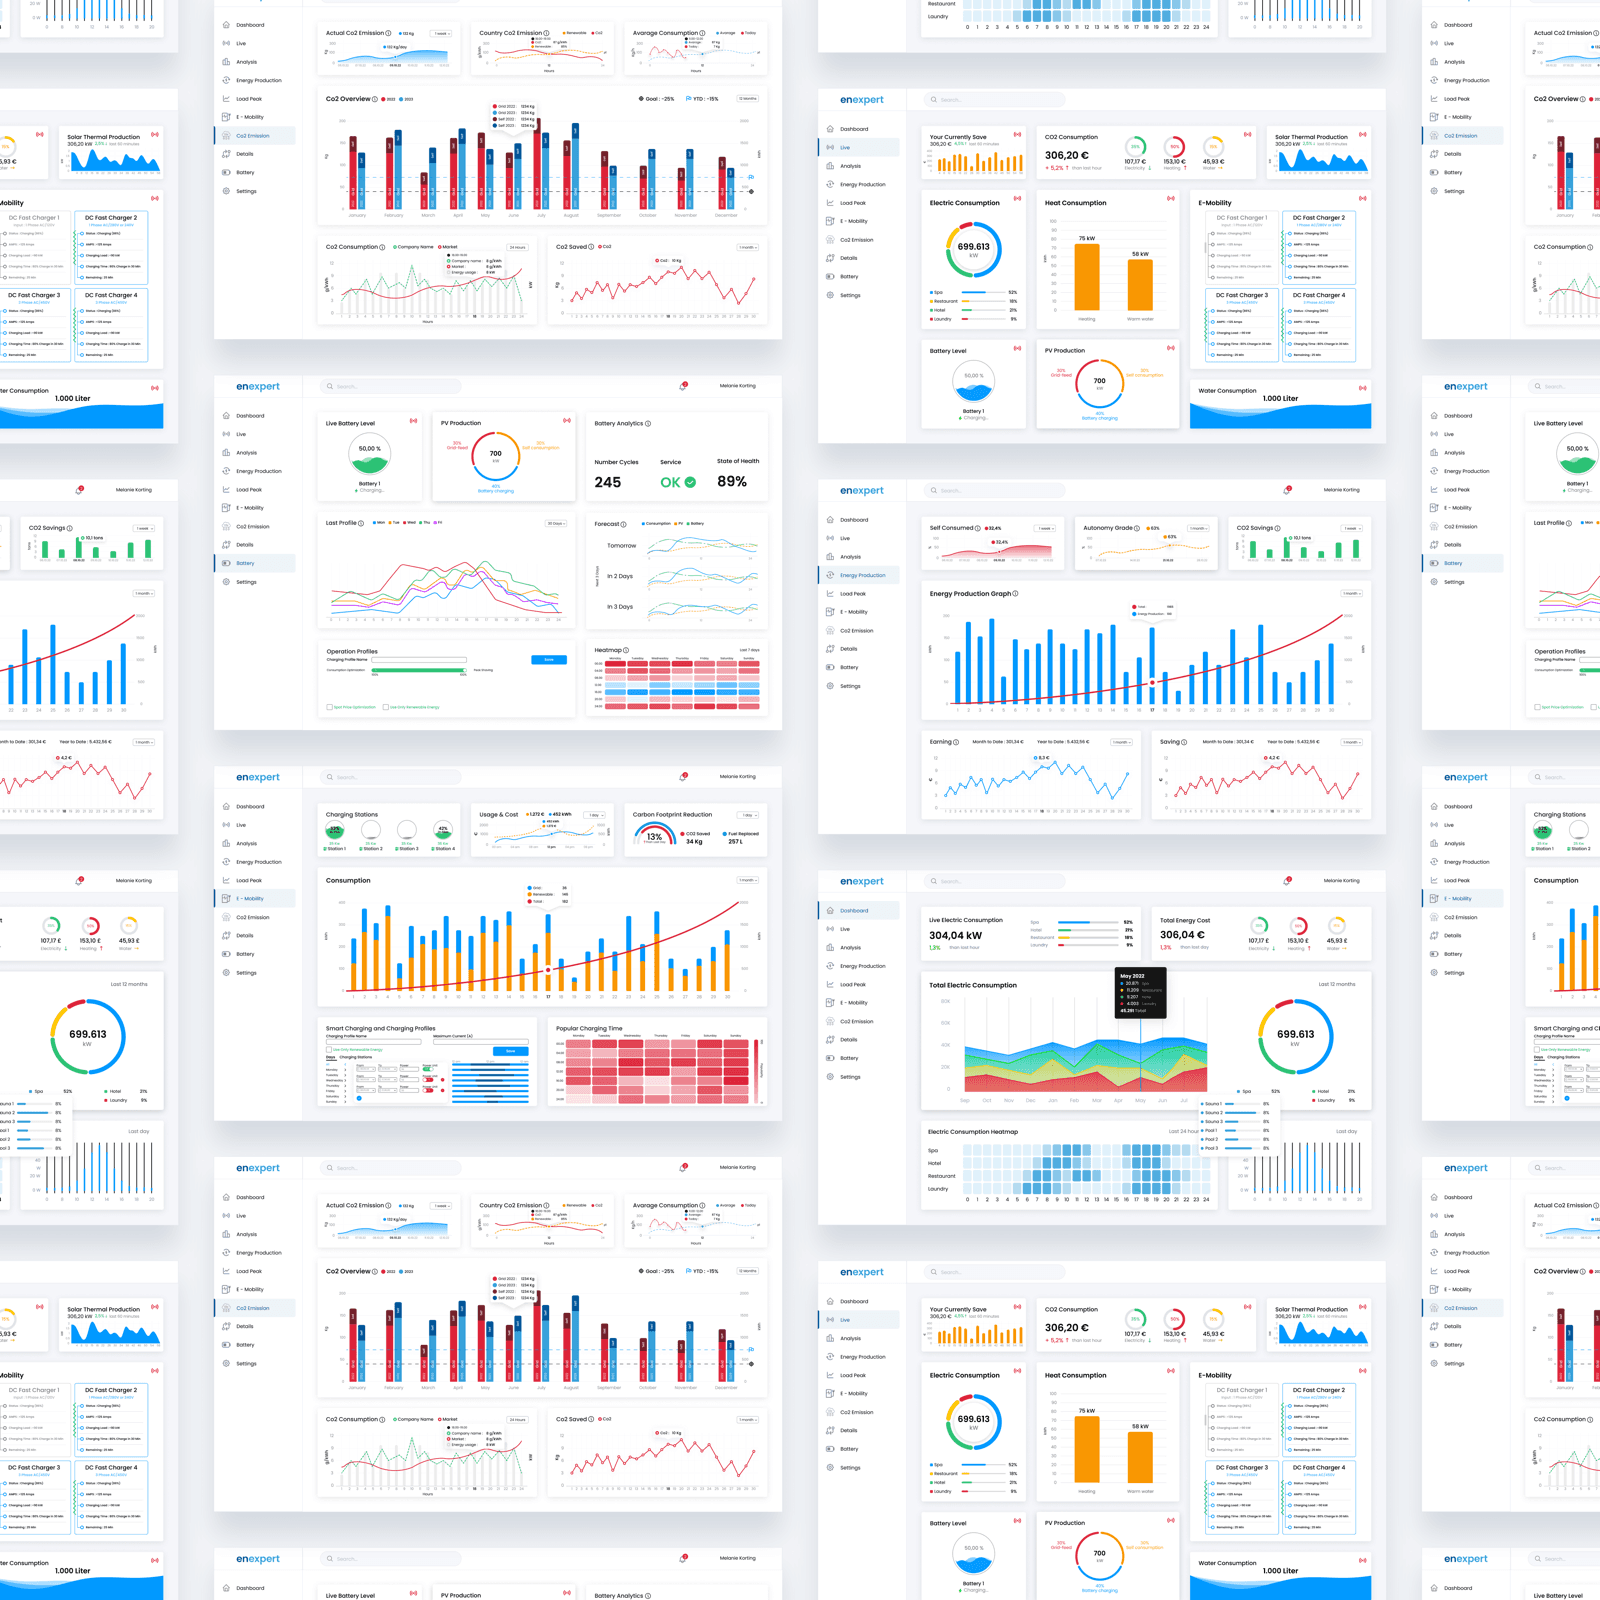
EnExpert Energy Management is a web platform that pulls energy data from meters, assets and IoT sensors and turns it into real-time dashboards for consumption, generation, load peaks, e-mobility and cost. The goal is not collecting data, but making energy visible and controllable in day-to-day operations.
Who it's for
Manufacturing and industrial companies, energy managers, facility and operations leads who want to see and control consumption, generation, load peaks and costs across sites in real time.
Why this is relevant
What matters is the engineering behind it: many heterogeneous data sources – meters, IoT sensors, assets – modeled cleanly, condensed into live dashboards and connected to CO₂, ESG and controlling views. An architecture that transfers to other data-intensive operational processes.
Features
- Real-time monitoring: consumption, generation and load are captured live and shown across sites, assets and areas.
- Load-peak management: load profiles become visible, so expensive peaks can be spotted, understood and reduced deliberately.
- Generation and e-mobility: on-site generation (e.g. PV) and charging infrastructure integrate into the same data view.
- Cost and controlling: energy use is linked to cost – as a basis for budgets, target/actual comparisons and reporting.
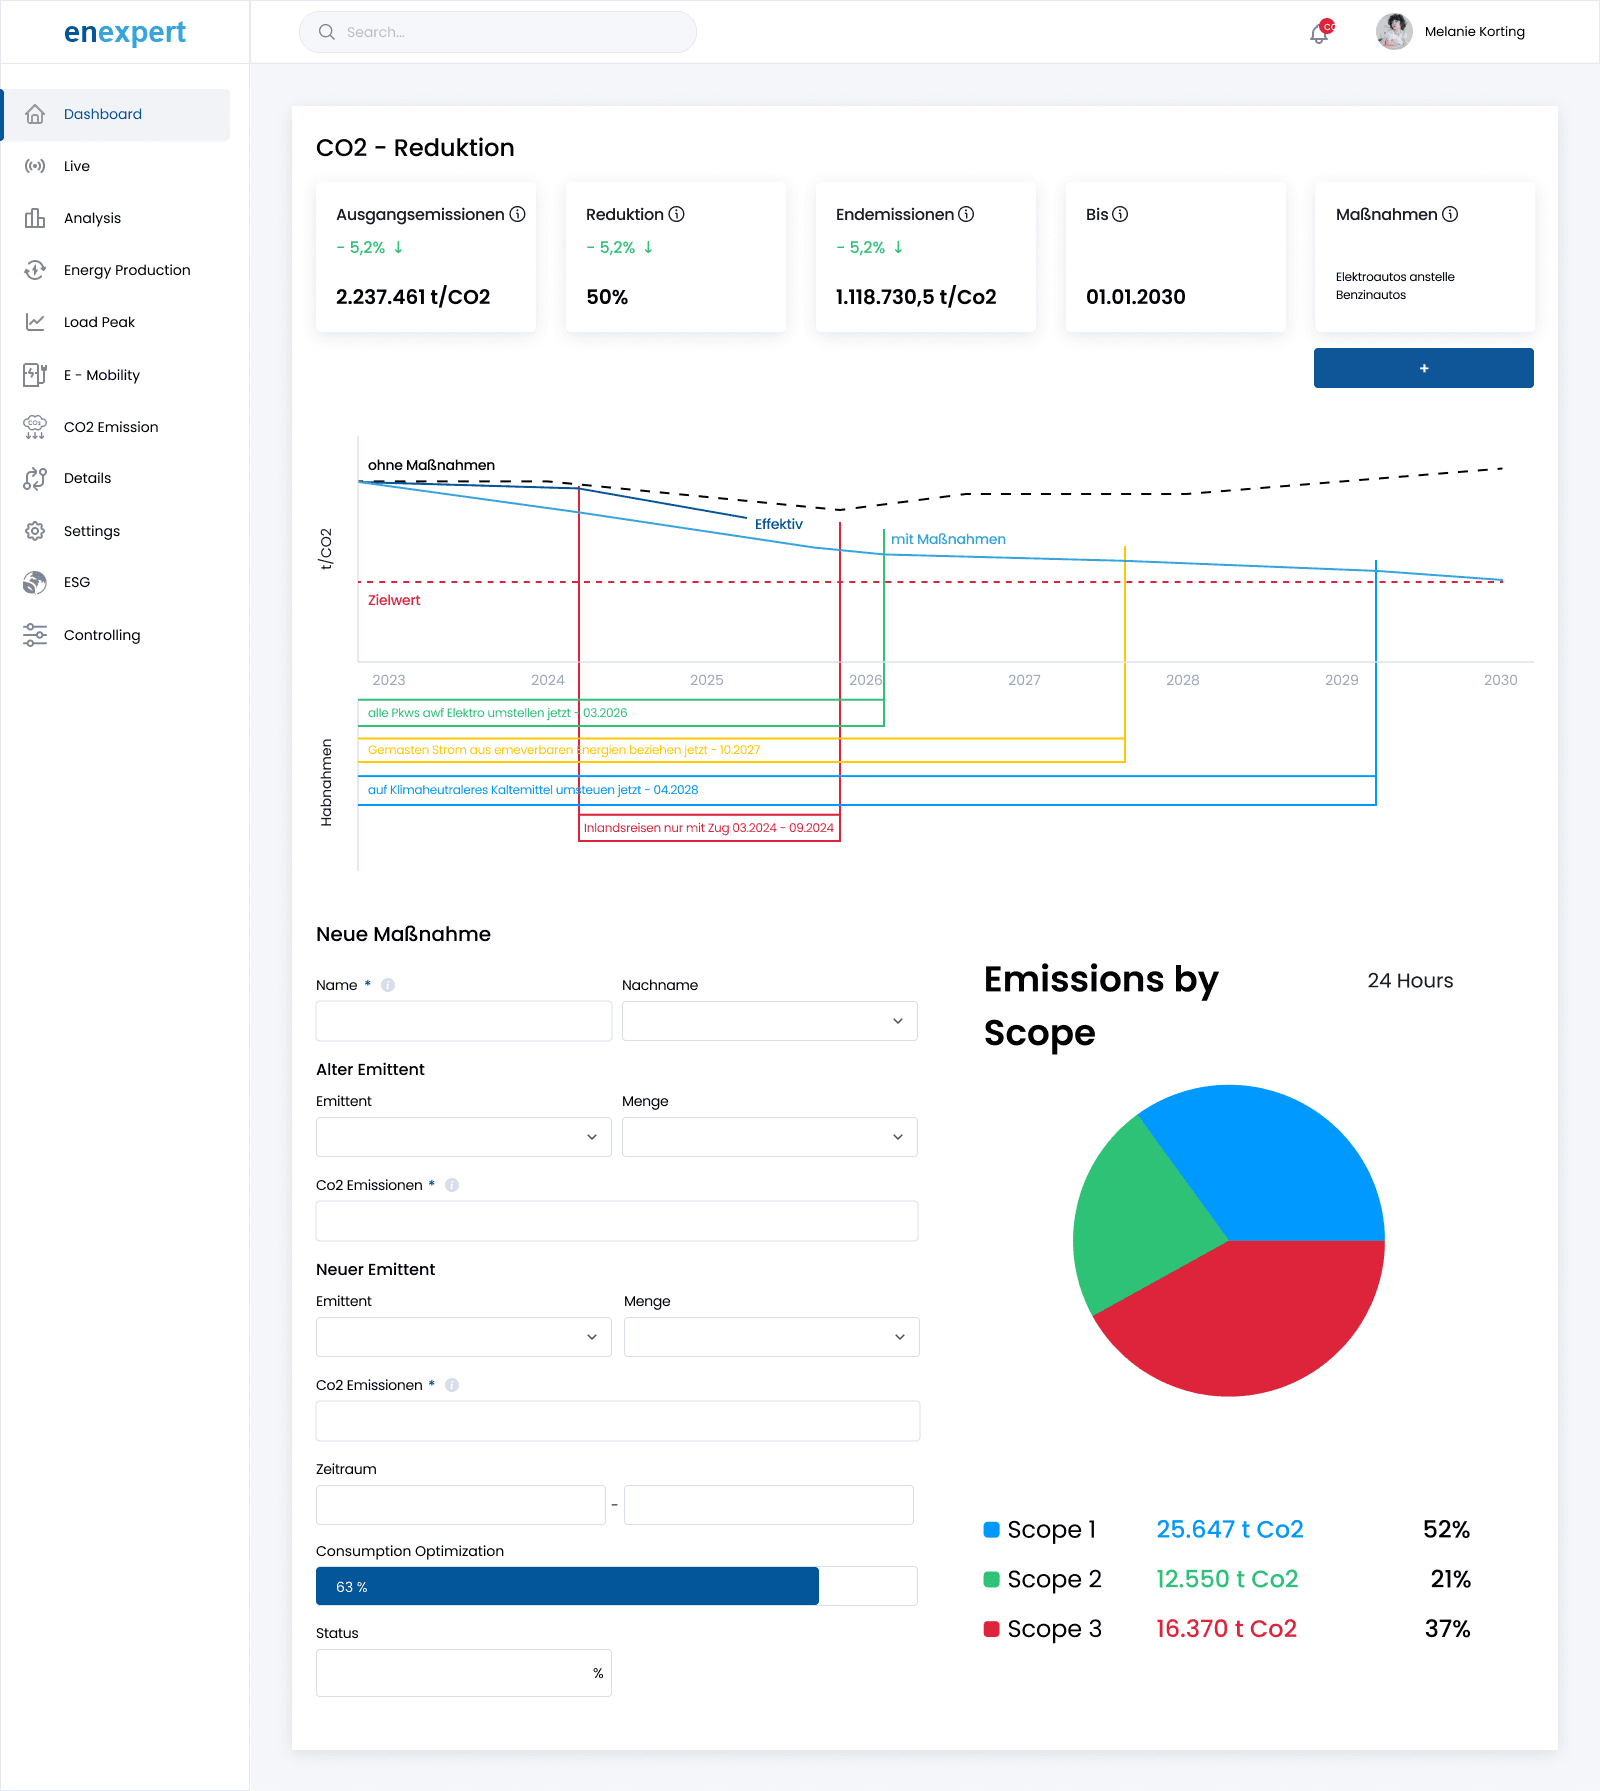
- CO₂ and ESG view: energy data feeds directly into CO₂ emissions and reduction pathways – energy and sustainability management in one system.
- Analysis instead of raw data: trends, anomalies and outliers are prepared, not just stored.
Workflow and architecture
Good energy management starts not at the dashboard but at the data foundation. EnExpert Energy Management therefore works in several layers:
- Capture data: meters, IoT sensors, asset and generation data are connected via interfaces.
- Model data: measurement points are mapped to sites, assets and areas, and normalized.
- Condense data: raw values become live dashboards for consumption, load peaks, generation and cost.
- Make data usable: CO₂, ESG and controlling views turn readings into decisions and measures.
The key point: the platform doesn't just collect data, it makes energy controllable – with a data architecture that stays robust even with many sources.
Availability
- Live: en-expert.com
- Product status: productive platform in use at industrial and commercial companies.
- Typical data sources: electricity, gas and heat meters, IoT sensors, PV and charging infrastructure, asset interfaces.
- Technical basis: web interface, data integration via standard interfaces, real-time processing, dashboards, and CO₂, ESG and controlling modules.
Why it's relevant
EnExpert Energy Management shows how we think about data-intensive operational processes: cleanly merging many heterogeneous sources, translating them into usable live views, and connecting them to adjacent topics like CO₂ and ESG. Exactly this architecture – integration, model, dashboards, derived metrics – transfers to other areas where data exists today but isn't yet controllable.
Next step
Bring 1–2 concrete questions from your energy or operations day-to-day – for example "where do our load peaks come from?" or "what does each area really cost us?". In an initial call we clarify which data sources exist and what a first monitoring setup could look like.
Glimpses
Ask for a similar build
Got a similar use case? We'll build it for you too.